Running GPU jobs in parallel on one Mac: memory is the scheduler
In the last post
a Kubeflow pipeline step trained a model on the Mac GPU through a SiliconJob. It ended with a list of limits, and two of them were these: one GPU job at a time, and no memory limit per job.
KubeSilicon v0.4 removes both. This post is about how, and about why the answer turned out to be memory and not the GPU.
The Apple GPU has no partitions
On a datacenter NVIDIA card you can slice the GPU (MIG, time slicing) and give each job a piece. The Apple GPU has nothing like that. Every process that uses Metal shares the whole GPU, and macOS decides who runs when.
So before building a scheduler, I measured whether running jobs side by side is worth it at all. MLX on an M5 Pro with 24 GB, one 6 s run per case:
| Workload | 1 job | 2 jobs (total) | 4 jobs (total) |
|---|---|---|---|
| Small MLP training, steps/s | 1,170 | 1,603 | 2,057 |
| 4096x4096 matmul loop, matmuls/s | 121 | 102 | 104 |
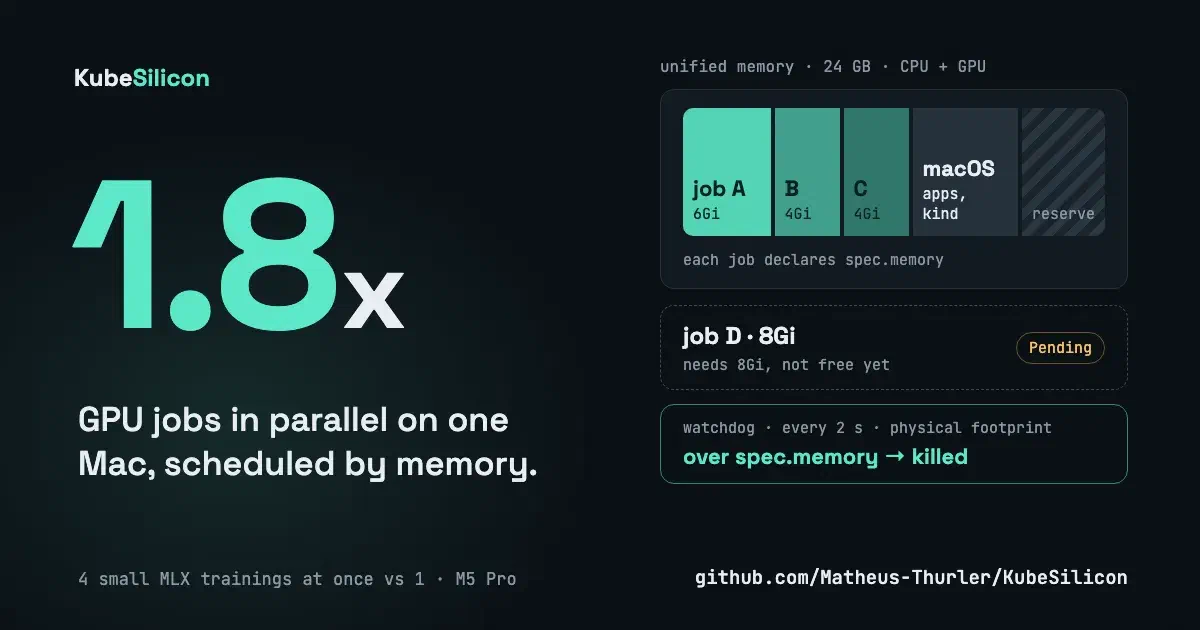
Four small trainings at once did 1.8x the work of one. Four big matmul loops did 0.85x: worse than one. A small model leaves the GPU idle between kernels, so a second job fills the gaps. A big one already keeps it busy, and a second job only adds switching.
So parallel jobs help exactly where a Mac is usually used for ML: small models, experiments, hyperparameter sweeps. They do not make one big training faster.
What actually runs out is memory
On Apple Silicon the GPU has no memory of its own. It shares the unified memory with the CPU and with everything else on the Mac, your browser and the kind cluster included. Two jobs that each want 10 GB on a 24 GB Mac do not slow down a little: the Mac starts to swap, and everything slows down.
That makes memory the resource to schedule. In v0.4 a job declares it:
apiVersion: kubesilicon.io/v1
kind: SiliconJob
metadata: { name: sweep-lr-0-01 }
spec:
  memory: 6Gi
  dependencies: [mlx]
  script: |
    ...
The daemon then follows three rules:
- A job starts when it fits. What macOS reports as available, minus what the running jobs declared and have not used yet, minus a reserve, must cover
spec.memory. The reserve is 10% of the RAM, at least 2 Gi (-memory-reservechanges it). - A job is killed when it lies. The runner measures the job every 2 s, CPU and GPU memory together, and kills it if it goes over:
Failed, “memory limit exceeded”. The peak goes to the end of the job log, so you can size the next run. - Jobs start in creation order, so a big job is not starved by small ones behind it. A job without
spec.memoryruns alone, as before.
Nothing is configured per Mac. The same YAML runs more jobs at once on a bigger or idler Mac, and fewer on a busy one. I did not want a “max parallel jobs” setting, because that number is different on every Mac and changes every time you open a browser.
The surprise: RSS does not see the GPU
The first version of the memory watchdog used RSS, the number most tools show for process memory. I tested it with a job that allocated 4 GiB with MLX. RSS said 19 MB.
RSS counts pages mapped into the process. Metal allocations live outside that view, so for a GPU job RSS is close to useless. What works is the physical footprint (ri_phys_footprint from proc_pid_rusage), the same number Activity Monitor calls “Memory”. For the same job it said 4,113 MB.
The watchdog sums the footprint of every process in the job’s process group, so a script that starts workers is measured as a whole.
How noisy is “available”?
The “available” side comes from kern.memorystatus_level, the number behind the memory pressure gauge. I sampled it once per second for a few minutes on a Mac that was not idle. With nothing starting, it moved by up to 1.2 GB in one second and 2.4 GB in ten. That is the size of the reserve.
It also measures pressure, not bytes: a job holding 4 GB almost disappeared from it after about ten seconds, because macOS compressed and swapped other memory to make room. That is why the formula also subtracts what running jobs declared and have not used yet. The per-job limit, not the global number, is what really protects the jobs that are already running.
Limits
- My numbers, one Mac. One run per case, MLX only, fp32. No PyTorch MPS numbers for the parallel case yet, and no power or thermal measurements.
- Parallel is not faster for big models. The table above says so.
- The watchdog samples every 2 s. A job can spike above its limit between samples. It is a guard against runaway jobs, not a hard wall like a cgroup; macOS has no cgroups.
- Still not a security boundary. Jobs run under
sandbox-exec. Do not run code you do not trust.
Try it
git clone https://github.com/Matheus-Thurler/KubeSilicon
cd KubeSilicon
make install CTX=kind-<your-cluster>
kubectl apply -f examples/mlx-matmul.yaml
Add memory: 4Gi to two copies of a job and watch them run together with kubectl get sjob -w. The details are in the README, under “Parallel jobs”. The code is at github.com/Matheus-Thurler/KubeSilicon
.
kubectl get related
| NAME | READY | STATUS | AGE |
|---|---|---|---|
 kubeflow-pipelines-apple-silicon-gpu-kubesilicon Training on the Mac GPU from Kubeflow Pipelines with KubeSilicon | 1/1 | Available | 4d |
 kubevirt-on-apple-silicon-kubesilicon KubeVirt does not run on Apple Silicon, so I built KubeSilicon | 1/1 | Available | 21d |
 virtfoundry-0-13-tenant-isolation Two tenants, one bridge: how we found and fixed a cross-tenant leak in VirtFoundry | 1/1 | Available | <1d |
kubectl get events